Seiteninhalt
Im Blickpunkt
Wann bekomme ich Wohngeld?
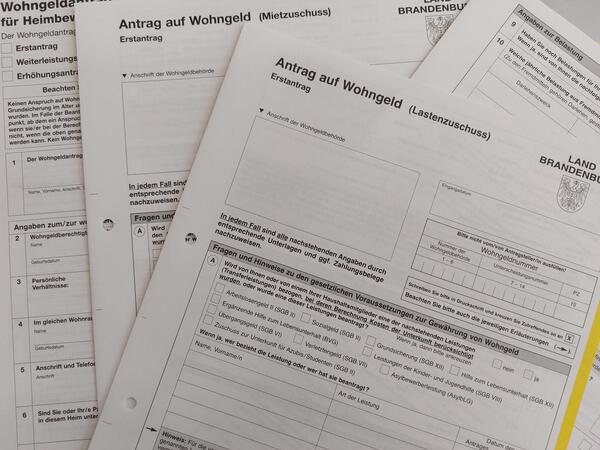
Hohe Kosten fürs Heizen, für Strom und Lebensmittel setzen viele Haushalte auch in Eisenhüttenstadt unter Druck. Das Wohngeld soll deshalb steigen um den Menschen mit wenig Einkommen bei den Mietzahlungen zu helfen.... ...weiterlesen
Willkommen in Eisenhüttenstadt

Ein besonderer Film über eine besondere Stadt: Eisenhüttenstadt
Sie planen einen Stadtbesuch?
Sie möchten hier arbeiten?
Sie möchten hier leben?
Sie möchten einfach wieder nach Hause ziehen? ...weiterlesen
Kommunale Unternehmen der Stadt Eisenhüttenstadt

Die Eisenhüttenstädter Gebäudewirtschaft GmbH (GeWi), die Stadtwerke, die Stadtwirtschaft und unser Städtisches Krankenhaus sind die vier Unternehmen die zu 100 Prozent der Stadt gehören.
...weiterlesen
Aktuelle Publikationen
Nachfolgende Druckerzeugnisse stehen als Download zur Verfügung:
Autor: Advantic Systemhaus GmbH


 Davis Sanchez @pexels.com


